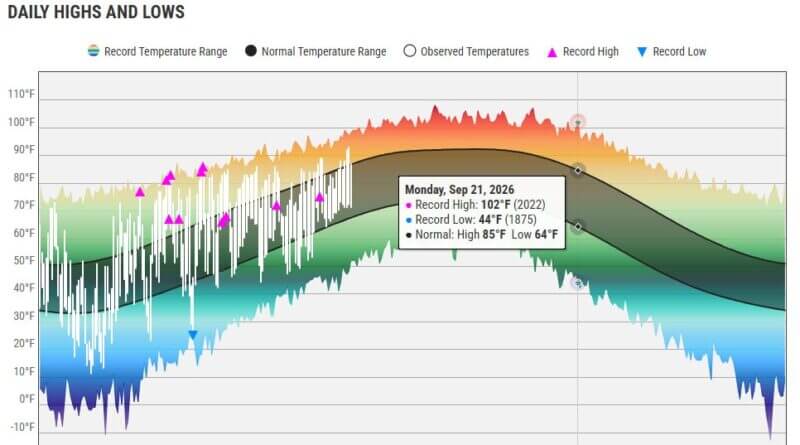
Weather officials have launched new interactive climate graphs for numerous reporting stations in the Mid-South, extending beyond Memphis. The graphs allow users to explore data with cursor-readouts for a detailed view.
Users can customize the display to focus on a specific month or review data from the past 30 days. The new tool also provides context by comparing current conditions with last January’s cold snap, which brought significant winter weather to the region.
The climate graphs are accessible on the National Weather Service website, offering an enhanced way to analyze recent weather patterns across the Mid-South.